Innovation Inspiration
SpecTrust Innovation Week is upon us again! The engineering team has set aside the standard roadmap to chase initiatives that improve our development experience, enhance our understanding, or otherwise provide value to the team or individual. This quarter brought some truly exciting projects! Forays into cloud service flexibilty, enhanced views in our hub experience, and further validation of the platform brought about some incredible wins and much excitement. Following the tradition of creating a collaborative Spotify playlist to help inspire such innovation, we also ended up having a ton of music to bond over — including era-defining classics, throwbacks, pure modern heaters, and down right bangers. This post is dedicated to that and the interesting insights it provided to us.
We had the highest level of contribution to this playlist in comparison with previous innovation week playlists. Seven people helped craft a playlist of 215 songs, extending over 15 hours of music. While some contributors created tight “flow pockets”, transitioning from piece to piece, others opted for a full on takeover of an artist or a vibe for a while. All musical offerings were accepted and there were no restrictions as to what could be added to the playlist. This resulted in it working both for continuous play and shuffle mode as thought was put into the movement behind the overarching themes. A quote from the presentation:
Music is tight. For reals, music is wild. Have y’all ever really thought about the phenomenon at large? Electrical energy converted into mechanical, compressing air and creating sound pressure levels, resonating tiny hairs and skin drums, resulting in involuntary movement while invoking every human emotion possible. WTF music, save some cool for the rest of us…
Analysis
With this spirit we marched forth producing some interesting data. Using Spotify analytics tools and the Spotify API, we gathered statistical and quantitative information we then used to analyze trends in valence, tempo, energy, danceability, and popularity while deriving some illuminating insights.
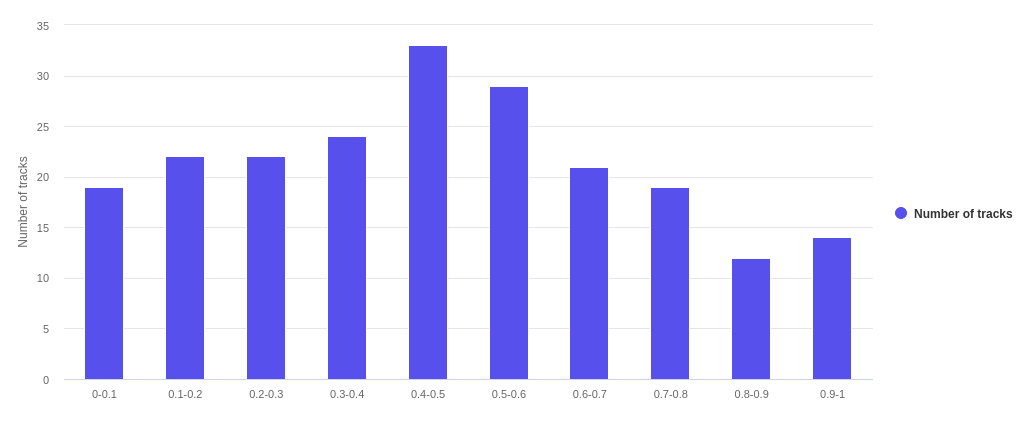
Valence
The valence metric given by Spotify is a measure of the musical positiveness conveyed by a track. The closer the valence number is to 1.0, the more happy or cheerful the track is perceived to be. The largest range of our tracks fell into the 0.4-0.5 scope, which was a reminder to us that musical expression matches the social atmosphere, offering a true reflection of our shared reality.
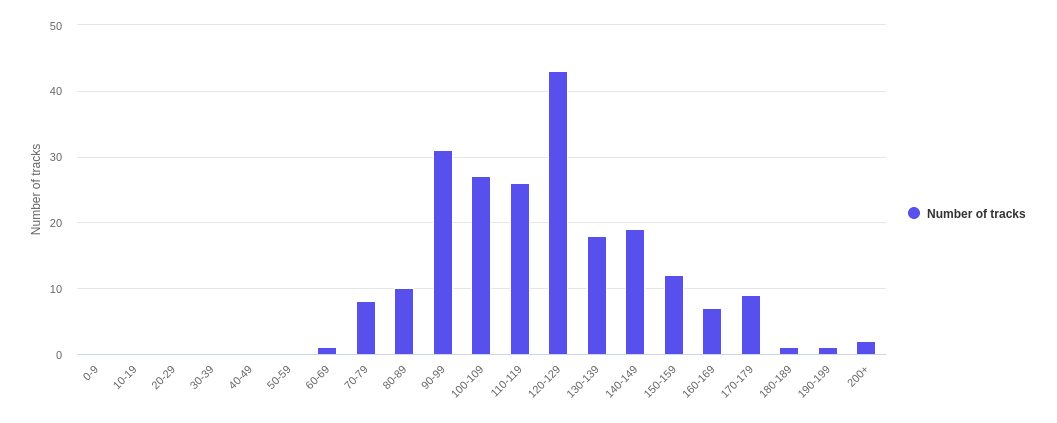
Tempo
Tempo can be described as the speed or rate of a given selection of music. A large amount of our tracks fell into the 120-129bpm range, which is somewhat expected given the trends of modern music. 128bpm is the most popular tempo in modern production for a few reasons, a large one being that the math is clean. A majority of music uses 4/4 time signature, which gives you 4 beats in a bar and 128 / 4 = 32. This means there are exactly 32 bars per minute. The range also resonates aesthetically well with most individuals.
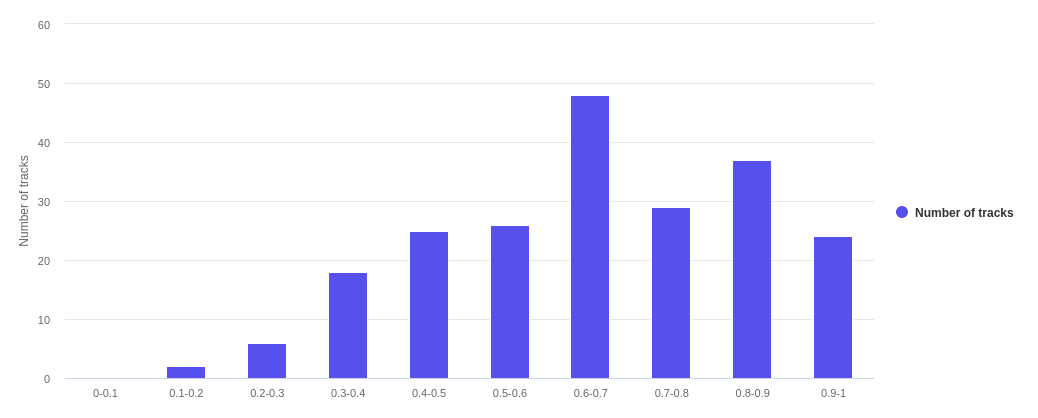
Energy
The energy metric given by the API is a measure of intensity for a given track. A group like Rage Against The Machine scores high on this, while Debussy would be at the low end of this scale. Given that we are able to see the majority of what was contributed had enough movement to keep the fingers moving on the keyboards.
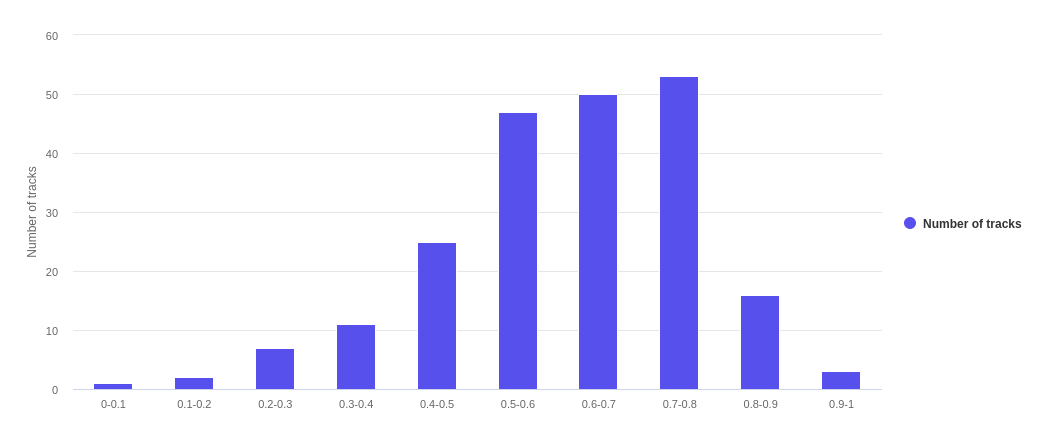
Danceability
Danceability is another Spotify metric given that can be defined as how suitable a given song is for dancing by compiling information regarding tempo, beat strength, and overall regularity. Our insight here is that even though the tone may be a bit darker given our valence distribution, we still dance like we don’t care.
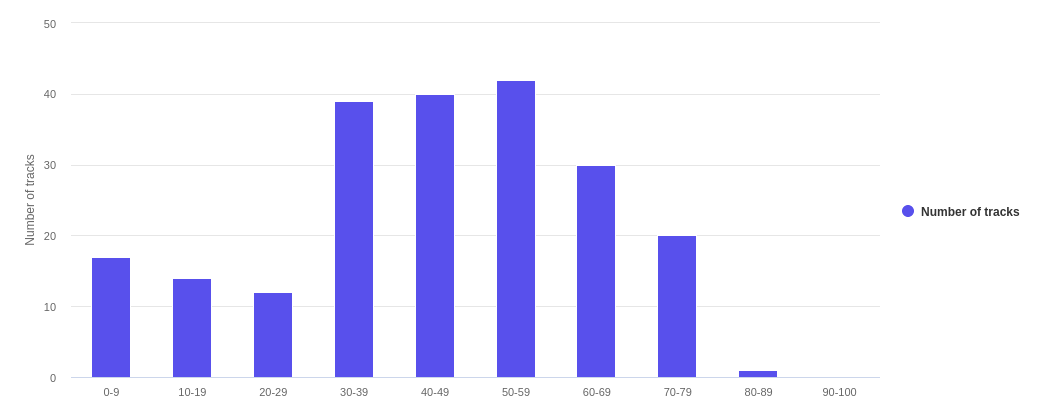
Popularity
Our final statistical dataset we found interesting was the popularity distribution, which is defined as how popular the track is with Spotify users on a scale of 0-100. Our results on this metric suggests that we have more eclectic tastes, prefer the up and coming, and do not listen to the radio much. We had 17 songs that were in the lowest 0-9 bracket, further solidifying our unique backgrounds and experiences in music.
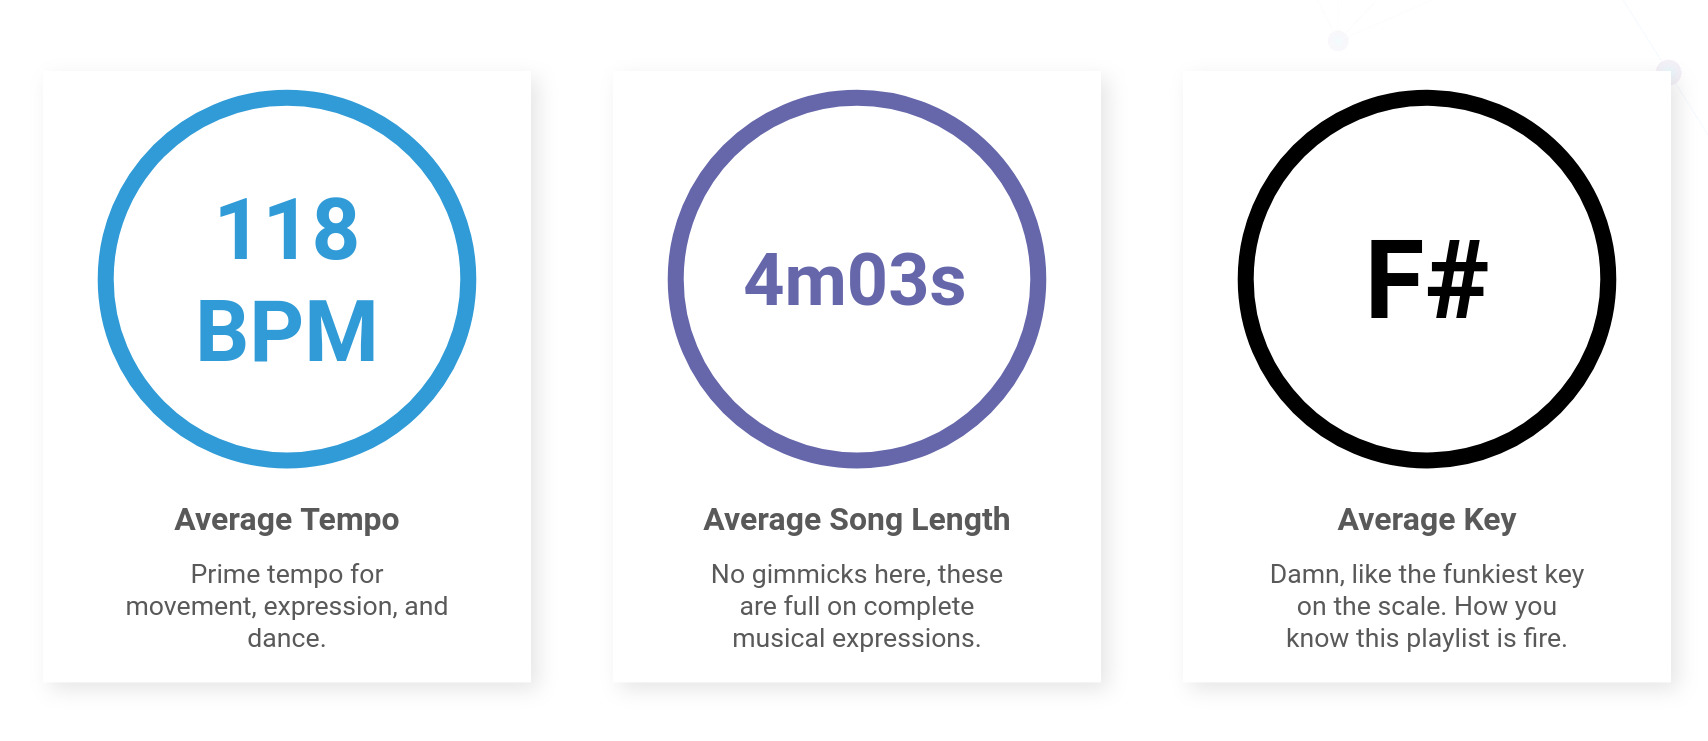
Slap Stats
We have defined a slap as a track in which there can be no denying its ability to influence spontaneous dance and head nods, as well as its universal ability to express emotions from a wide range of listeners. In addition to the categories assigned above, we found the following to be some excellent metrics of slap worth noting.
Conclusion
Thank you for sticking around, I hope it was as entertaining to read as it was to write. Music offers the ability to bond and strengthen relations, and this ultimately proved to be a wonderful team exercise. The output of this is a testament to the culture we have built here collaboratively, as well as a showcase of the diversity among us. If you would like to listen to the playlist give it a follow!